Technology
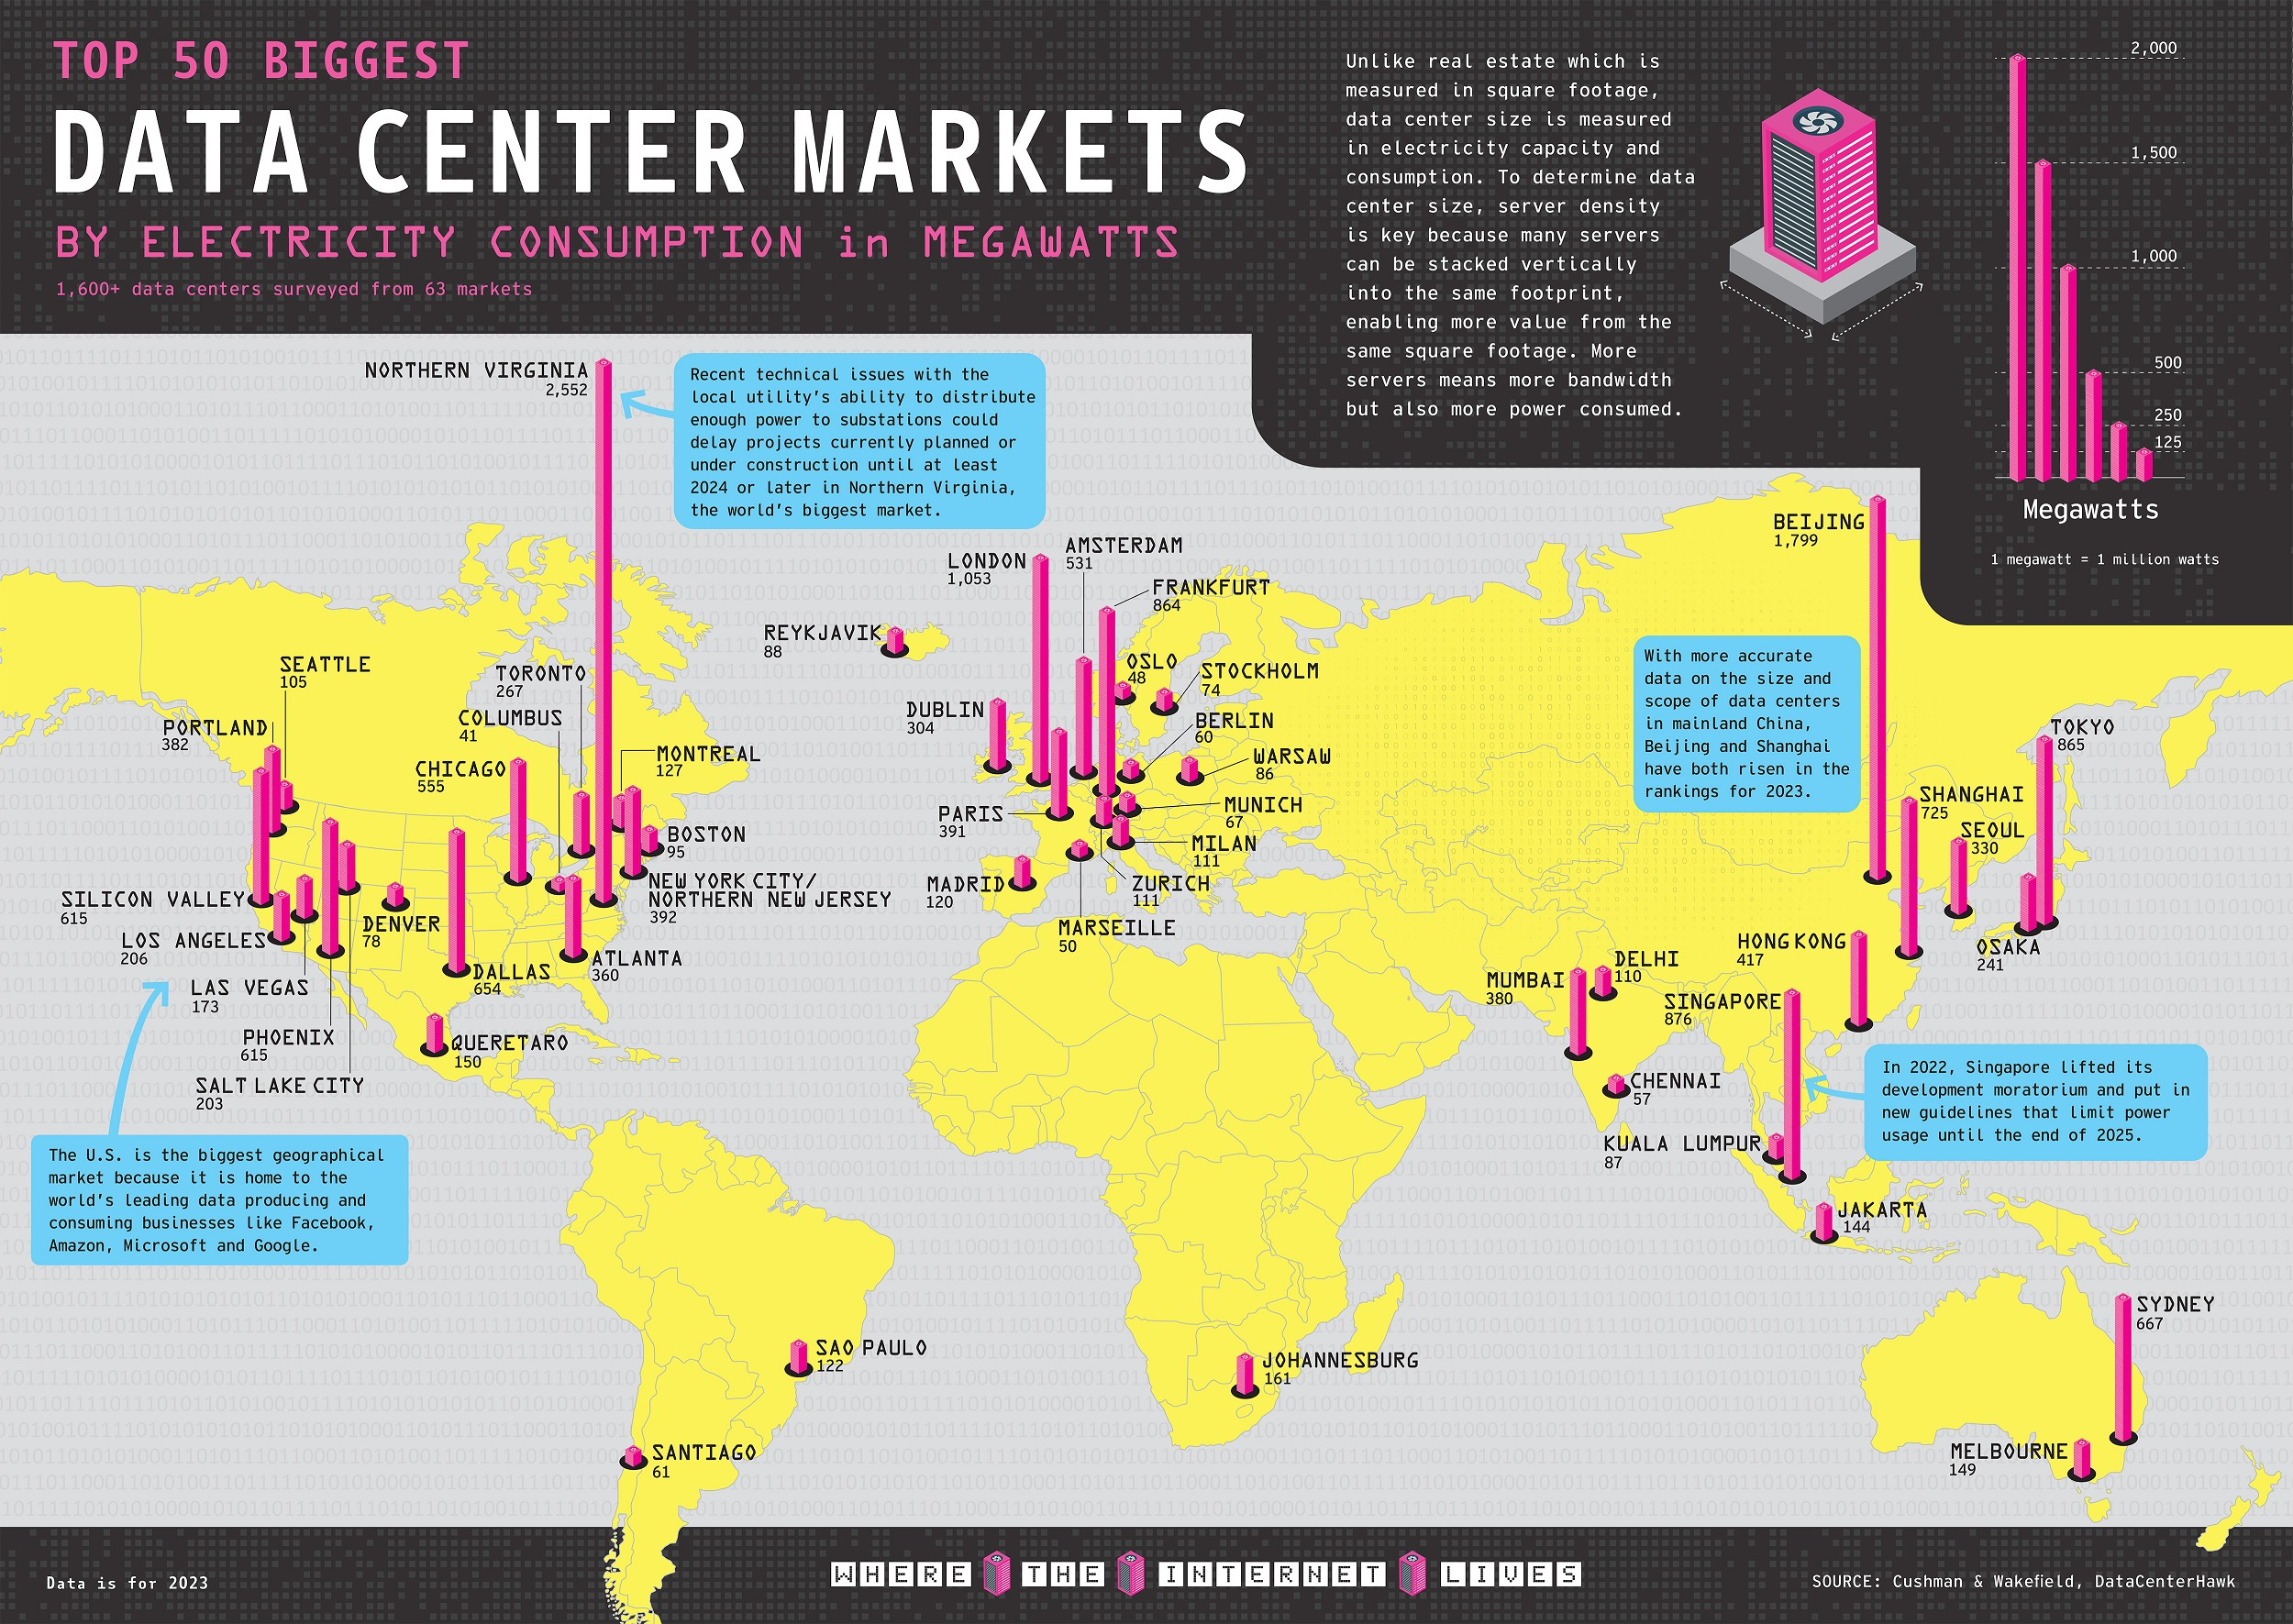
Ranked: Top 50 Data Center Markets by Power Consumption
Article/Editing:
Click to view this graphic in a higher-resolution.

Top 50 Data Center Markets by Power Consumption
We live in an information-abundant digital world, where data is the new currency, and data centers are the vaults that protect and power it.
The amount of data created each year has skyrocketed from 2 zettabytes in 2010 to 44 zettabytes (44 trillion gigabytes) in 2020. This has surged demand for data storage and processing, leading to the construction of massive data centers around the world.
So, where are the biggest data centers?
In this graphic, Julie Peasley uses 2023 data from Cushman & Wakefield to shed light on the biggest data center markets.
The Biggest Data Center Markets
Today, it is estimated that there are over 8,000 data centers in the world.
Many of these centers end up clustered together due to beneficial infrastructure and provisions from local governments and utilities. They also need lots of power, often at least 100 MW for each center, making power consumption one of the best ways to measure total market size.
While a majority of these data center markets are in the United States, some of them are scattered across Asia and Europe.
| Rank | Data Center Market | Country | Capacity (MW) |
|---|---|---|---|
| 1 | Northern Virginia | 🇺🇸 United States | 2,552 |
| 2 | Beijing | 🇨🇳 China | 1,799 |
| 3 | London | 🇬🇧 United Kingdom | 1,053 |
| 4 | Singapore | 🇸🇬 Singapore | 876 |
| 5 | Tokyo | 🇯🇵 Japan | 865 |
| 6 | Frankfurt | 🇩🇪 Germany | 864 |
| 7 | Shanghai | 🇨🇳 China | 725 |
| 8 | Sydney | 🇦🇺 Australia | 667 |
| 9 | Dallas | 🇺🇸 United States | 654 |
| 10 | Silicon Valley | 🇺🇸 United States | 615 |
| 11 | Phoenix | 🇺🇸 United States | 615 |
| 12 | Chicago | 🇺🇸 United States | 555 |
| 13 | Amsterdam | 🇳🇱 Netherlands | 531 |
| 14 | Hong Kong | 🇭🇰 Hong Kong | 417 |
| 15 | New York City - Northern New Jersey | 🇺🇸 United States | 392 |
| 16 | Paris | 🇫🇷 France | 391 |
| 17 | Portland | 🇺🇸 United States | 382 |
| 18 | Mumbai | 🇮🇳 India | 380 |
| 19 | Atlanta | 🇺🇸 United States | 360 |
| 20 | Seoul | 🇰🇷 South Korea | 330 |
| 21 | Dublin | 🇮🇪 Ireland | 304 |
| 22 | Toronto | 🇨🇦 Canada | 267 |
| 23 | Osaka | 🇯🇵 Japan | 241 |
| 24 | Los Angeles | 🇺🇸 United States | 206 |
| 25 | Salt Lake City | 🇺🇸 United States | 203 |
| 26 | Las Vegas | 🇺🇸 United States | 173 |
| 27 | Johannesburg | 🇿🇦 South Africa | 161 |
| 28 | Querétaro | 🇲🇽 Mexico | 150 |
| 29 | Melbourne | 🇦🇺 Australia | 149 |
| 30 | Jakarta | 🇮🇩 Indonesia | 144 |
| 31 | Montreal | 🇨🇦 Canada | 127 |
| 32 | São Paulo | 🇧🇷 Brazil | 122 |
| 33 | Madrid | 🇪🇸 Spain | 120 |
| 34 | Milan | 🇮🇹 Italy | 111 |
| 35 | Zurich | 🇨🇭 Switzerland | 111 |
| 36 | Delhi | 🇮🇳 India | 110 |
| 37 | Seattle | 🇺🇸 United States | 105 |
| 38 | Boston | 🇺🇸 United States | 95 |
| 39 | Reykjavík | 🇮🇸 Iceland | 88 |
| 40 | Kuala Lumpur | 🇲🇾 Malaysia | 87 |
| 41 | Warsaw | 🇵🇱 Poland | 86 |
| 42 | Denver | 🇺🇸 United States | 78 |
| 43 | Stockholm | 🇸🇪 Sweden | 74 |
| 44 | Munich | 🇩🇪 Germany | 67 |
| 45 | Santiago | 🇨🇱 Chile | 61 |
| 46 | Berlin | 🇩🇪 Germany | 60 |
| 47 | Chennai | 🇮🇳 India | 57 |
| 48 | Marseille | 🇫🇷 France | 50 |
| 49 | Oslo | 🇳🇴 Norway | 48 |
| 50 | Columbus | 🇺🇸 United States | 41 |
With nearly 300 data centers, including many AWS servers, the Northern Virginia data center market is the largest in the world. Data centers in the region are estimated to handle more than one-third of global online traffic.
In 2023, Northern Virginia data centers had a combined power consumption capacity of 2,552 MW. That’s four times the capacity of the next closest American markets, Dallas (654 MW) and Silicon Valley (615 MW).
The second-biggest market, Beijing, has a measured capacity of 1,799 MW. Though it is currently the only market with an operational capacity of over 1,000 MW in the Asia Pacific Region, Tokyo (865 MW) appears to be catching up fast.
Europe’s biggest data center clusters are in London (1,053 MW) and Frankfurt (864 MW), largely due to demand from large local enterprises and organizations. It’s no coincidence that they are major hubs for government and commerce—the world’s largest data center markets are near capital cities, as historically, governments (and their militaries) were the first to invest in internet infrastructure.
Future of Data
Data centers will continue growing in scale and expanding into new markets to meet the demands of digitalization.
Already the wider adoption of artificial intelligence has changed where internet data is flowing. And with increasing digital demands, the amount of energy needed to power these centers also increases.
That has increasingly put the spotlight not just on companies and data center markets, but on the energy they’re using. With massive power consumption requirements, efficiency and sustainability become increasingly important, and not every market is prioritizing efficient sources of electricity.

This article was published as a part of Visual Capitalist's Creator Program, which features data-driven visuals from some of our favorite Creators around the world.


Technology
Countries With the Highest Rates of Crypto Ownership
While the U.S. is a major market for cryptocurrencies, two countries surpass it in terms of their rates of crypto ownership.


Countries With the Highest Rates of Crypto Ownership
This was originally posted on our Voronoi app. Download the app for free on iOS or Android and discover incredible data-driven charts from a variety of trusted sources.
This graphic ranks the top 10 countries by their rate of cryptocurrency ownership, which is the percentage of the population that owns crypto. These figures come from crypto payment gateway, Triple-A, and are as of 2023.
Data and Highlights
The table below lists the rates of crypto ownership in the top 10 countries, as well as the number of people this amounts to.
| Country | % of Population Who Own Crypto | # of Crypto Owners |
|---|---|---|
| 🇦🇪 United Arab Emirates | 30.4 | 3M |
| 🇻🇳 Vietnam | 21.2 | 21M |
| 🇺🇸 U.S. | 15.6 | 53M |
| 🇮🇷 Iran | 13.5 | 12M |
| 🇵🇭 Philippines | 13.4 | 16M |
| 🇧🇷 Brazil | 12 | 26M |
| 🇸🇦 Saudi Arabia | 11.4 | 4M |
| 🇸🇬 Singapore | 11.1 | 665K |
| 🇺🇦 Ukraine | 10.6 | 4M |
| 🇻🇪 Venezuela | 10.3 | 3M |
Note that if we were to rank countries based on their actual number of crypto owners, India would rank first at 93 million people, China would rank second at 59 million people, and the U.S. would rank third at 52 million people.
The UAE Takes the Top Spot
The United Arab Emirates (UAE) boasts the highest rates of crypto ownership globally. The country’s government is considered to be very crypto friendly, as described in Henley & Partners’ Crypto Wealth Report 2023:
In the UAE, the Financial Services Regulatory Authority (FSRA-ADGM) was the first to provide rules and regulations regarding cryptocurrency purchasing and selling. The Emirates are generally very open to new technologies and have proposed zero taxes for crypto owners and businesses.
Vietnam leads Southeast Asia
According to the Crypto Council for Innovation, cryptocurrency holdings in Vietnam are also untaxed, making them an attractive asset.
Another reason for Vietnam’s high rates of ownership could be its large unbanked population (people without access to financial services). Cryptocurrencies may provide an alternative means of accessing these services without relying on traditional banks.
Learn More About Crypto From Visual Capitalist
If you enjoyed this post, be sure to check out The World’s Largest Corporate Holders of Bitcoin, which ranks the top 12 publicly traded companies by their Bitcoin holdings.

-

 Energy4 days ago
Who’s Building the Most Solar Energy?
-

 Wealth2 weeks ago
Charted: Which Country Has the Most Billionaires in 2024?
-

 Markets2 weeks ago
The Top Private Equity Firms by Country
-

 Jobs1 week ago
The Best U.S. Companies to Work for According to LinkedIn
-

 Economy1 week ago
Ranked: The Top 20 Countries in Debt to China
-

 Misc1 week ago
Charted: Trust in Government Institutions by G7 Countries
-

 Energy1 week ago
Mapped: The Age of Energy Projects in Interconnection Queues, by State
-

 Mining1 week ago
Visualizing Global Gold Production in 2023